Ken over at
kenskingdom has just posted an analysis of GISS data compared to BOM data for Gladstone in Queensland, Australia. Ken’s blog is new but the way it is going it looks like developing into a must read for those interested in the Australian data.
Ken’s
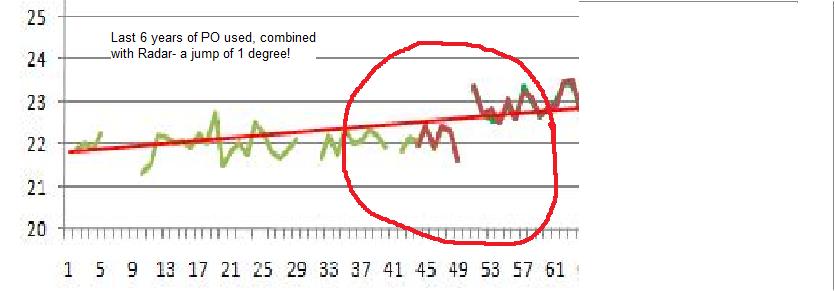
analysis of Gladstone shows an exaggerated warming trend for Gladstone. His conclusion:
Although GISS can truthfully say they have not adjusted the GHCN data, the splicing of the last 6 years of the Post Office dataset to the warmer Gladstone Radar leads to a trend of 1.7 degrees Celsius per Century.
I have shown three possible options for more appropriate adjustments to combine all temperatures at the one site. Of these, the highest trend is about 1.5 degrees, which is close to the trend (1.4 degrees) of the nearest rural sites. Examination of these sites shows that their data is of questionable quality. The second option produces a trend of 0.9 degrees, and the third and (in my opinion) best option, 0.7 degrees. The average trend of the 5 nearest long-record rural sites (0.8 degrees) is between these last two options and so matches well. Nearby cities of Rockhampton and Bundaberg show adjusted trends of about 0.7 and 0.5 degrees respectively, and Maryborough, ignored by GHCN, shows a trend of 0.4 degrees.
Ken is a retired school headmaster and his blog is concentrating on graphical analysis of temperature data relating to Australian towns and cities.
My conclusion:
Bookmark Ken’s blog – it gets more interesting with each post.


No comments:
Post a Comment